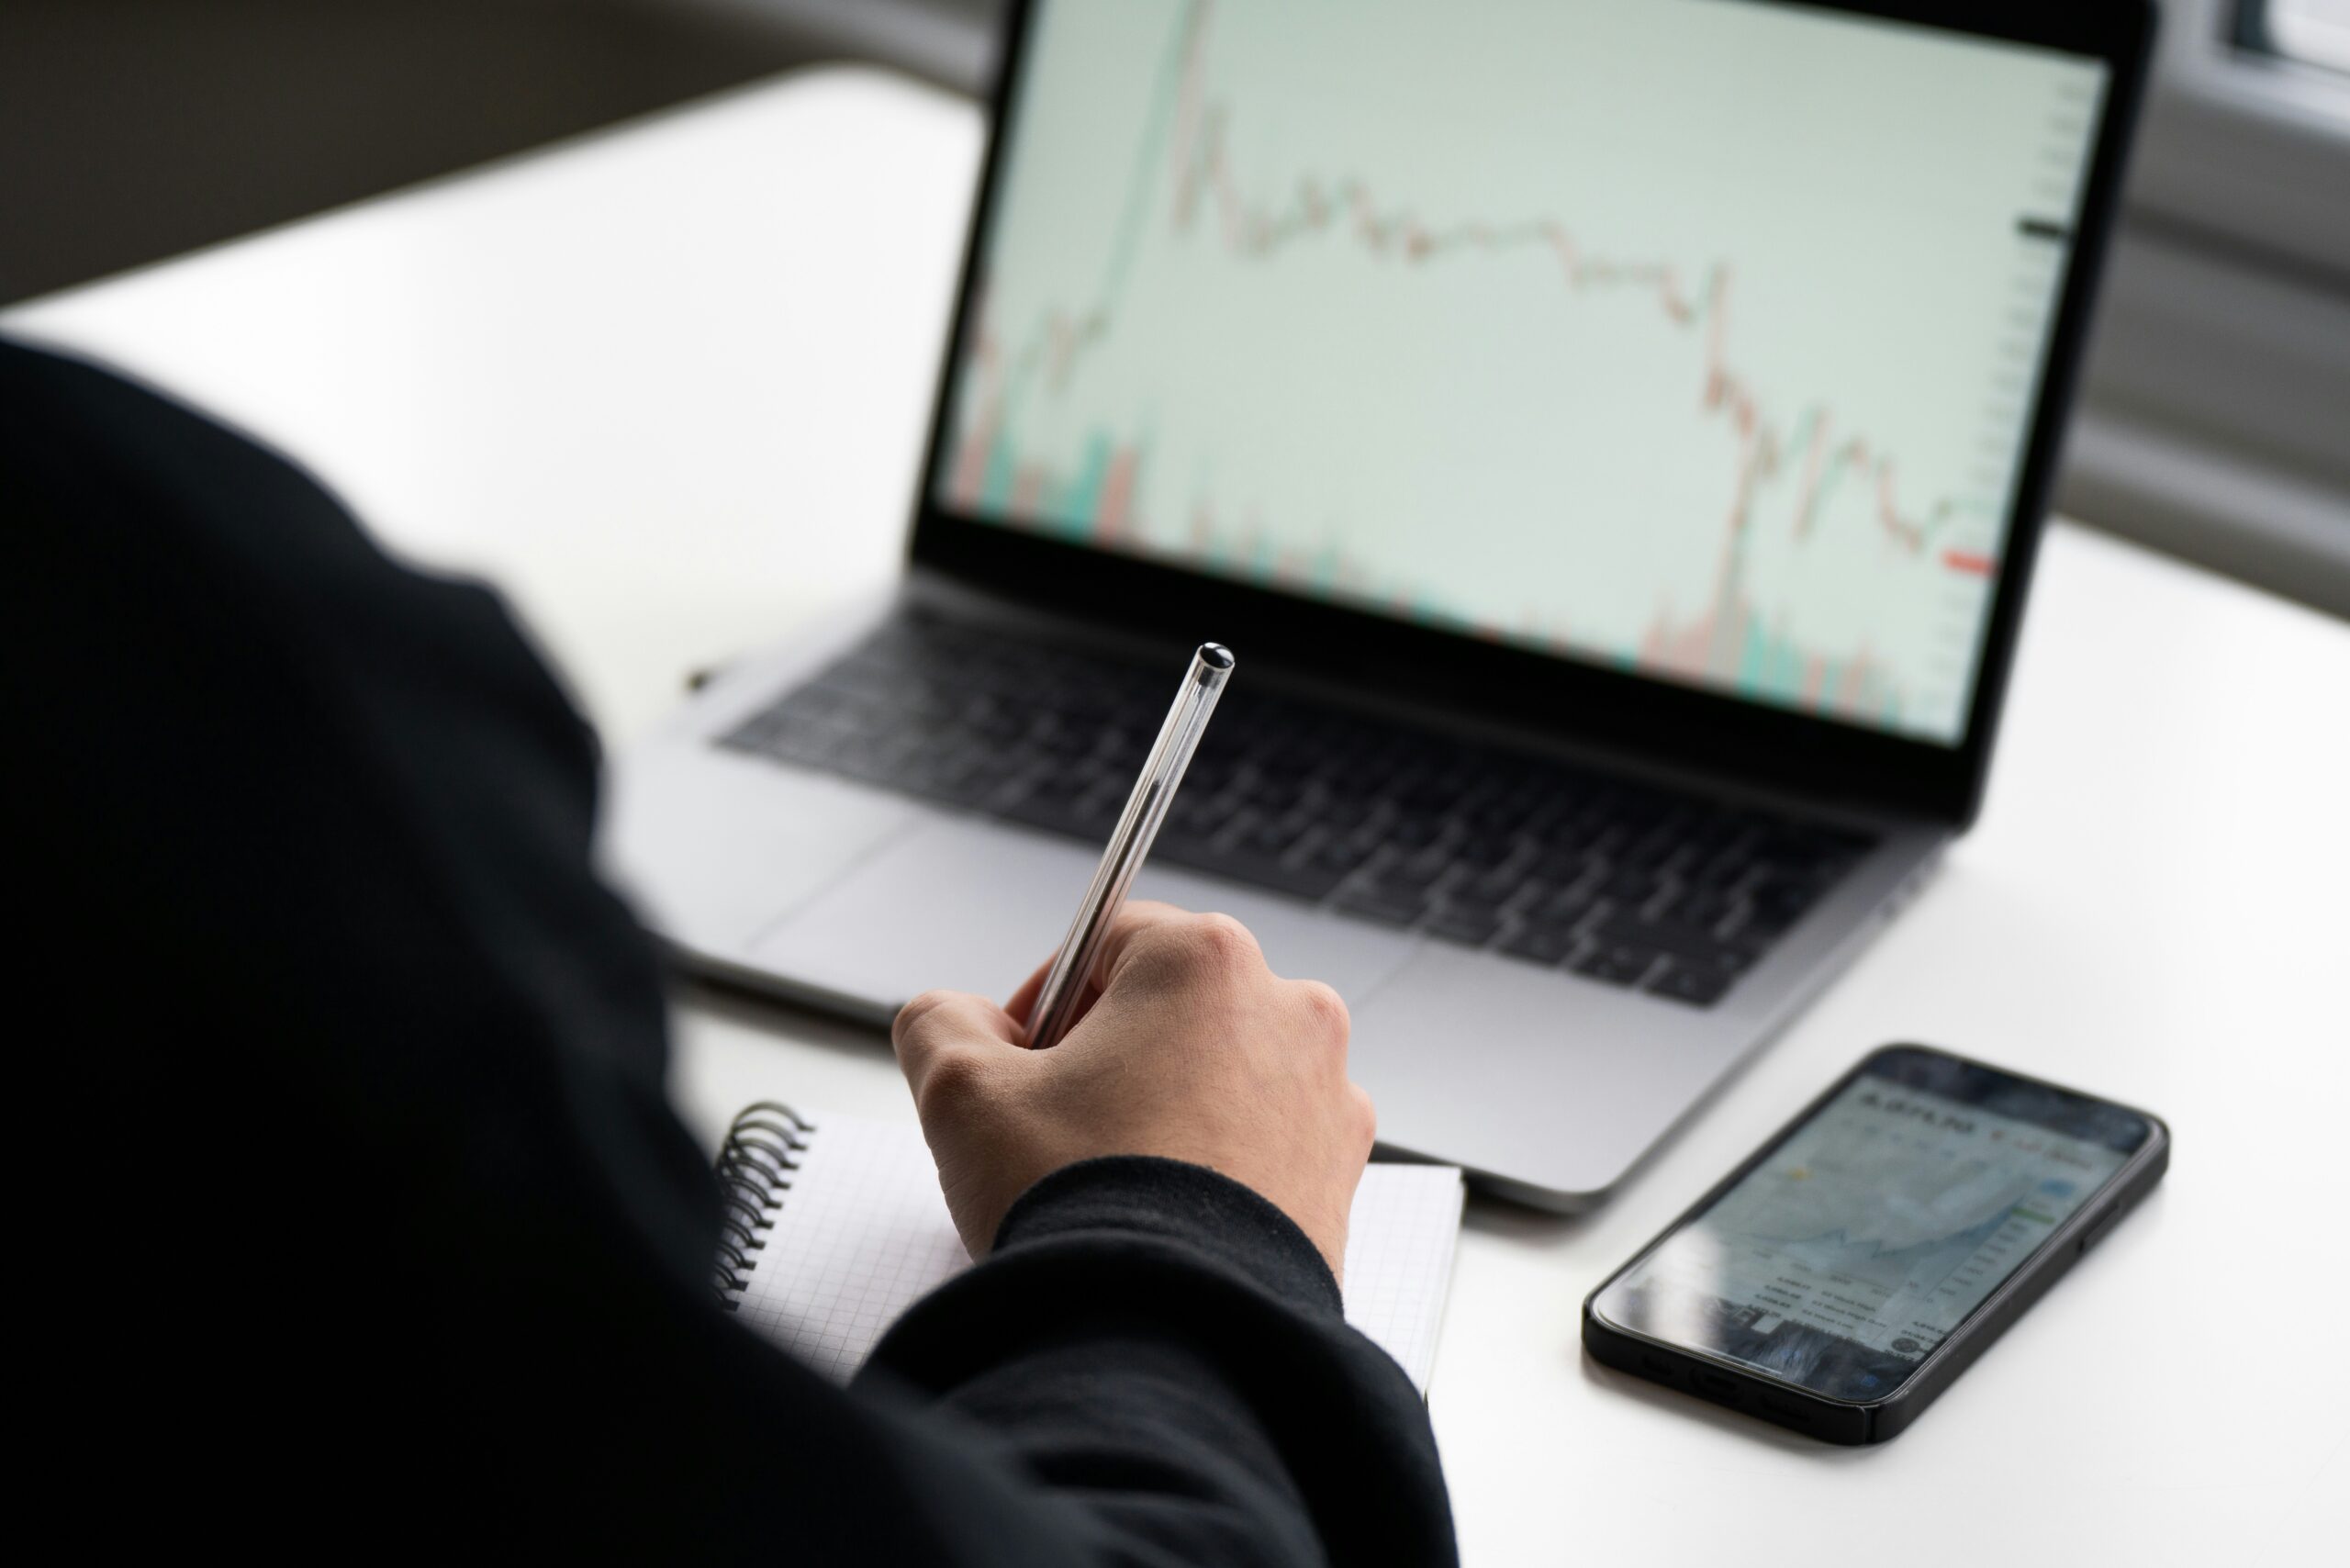
Markets are full of fast decisions. Prices jump or drop without warning. For professional traders, every second matters. One quick move in the wrong direction can turn a win into a loss.
This is why they don’t trade blind. They use charting tools — not to predict the future but to see what’s happening right now, in real detail. It helps them track volume, read price action, and act fast when opportunity shows up.
These tools don’t guarantee profit, but they offer a better view. That edge makes a difference in fast-moving markets.
The Role of Charting Tools in Modern Trading
Old charts showed the price over time. That worked when markets moved more slowly. Today, that’s not enough. Traders need to track not only the price but also the flow of orders, volume at different levels, and patterns that shift within minutes.
Charting software for traders does more than show candles or lines. It shows how many orders are sitting at a price, who’s buying or selling, and where volume clusters. Some platforms offer heatmaps or custom indicators, which help traders notice things they’d miss on a basic chart.
The tools don’t replace judgment. But they support it with better data and faster reaction time. This is especially helpful in high-volume markets like futures, options, or short-term equity trades.
What Is Chart Trading and How Does It Benefit Traders?
Most retail traders place orders in a separate window. That takes extra time and adds room for mistakes. Chart-based trading changes that. It lets traders place, adjust, or cancel orders right from the chart.
This makes the whole process smoother. You see the entry, the stop-loss, and the target, all in one place. And you can act on changes as they happen. When price hits a level you’re watching, you don’t have to fumble around — it’s one click.
Trading directly from the chart also gives more context. You’re not just placing numbers; you’re placing them based on what you see.
That’s useful for short-term traders who work fast or for those managing multiple positions. It cuts down on guesswork and speeds up execution. That’s why so many professionals use it.
Footprint Chart Software: Seeing Inside the Market
Standard charts show price action. But they don’t show what happens inside each candle. That’s where charting tools with footprint analysis help.
Footprint charts break down each bar into traded volume at every price level. They help answer not just what happened but also how it happened.
Here’s what you can read from a footprint chart:
- Volume traded at each price
- Bid–ask activity showing order aggression
- Imbalances between buyers and sellers
- Signs of absorption or momentum shifts
- Hints of reversal during high-volume moves.
This level of detail is most useful when price moves fast or change direction. That’s when good decisions rely on more than just price.
Platforms like Atas.net are built around this type of precision. Their tools help traders follow the flow of orders, not just the chart. You’re not just seeing where the market went — you’re seeing what drove it.
Managing Crypto Market Volatility With Advanced Tools
Digital currency trading doesn’t follow the same rules as traditional markets. It runs all day, every day. There’s no pause, no weekend break, and the price can swing 10% in minutes. This puts pressure on both traders and tools.
Crypto charting software helps manage that. It tracks volume across multiple exchanges. It shows where large orders are placed. It alerts you when a sudden move happens or when the price approaches a zone of heavy activity.
The digital currency market is also fragmented. The same asset might trade at slightly different prices on different platforms. Good crypto charting tools help traders spot these gaps or find where liquidity is stronger.
It also helps avoid traps. Sudden spikes, fake breakouts, or “whale” activity are common. With better data on volume and order flow, traders can react more calmly — and not just follow the noise.
Key Features Professionals Look For
Not every platform is built for high-level trading. Some focus on clean visuals, others on speed. The best ones offer both — plus a range of features traders actually use every day.
Here are some of the tools that matter most:
- Real-time market depth
- Footprint charts with volume breakdown
- Clear volume profiles and session markers
- Reliable one-click execution for chart trading
- Flexible layout options for different markets,
- Smooth performance with no lag during news or volatility.
ATAS offers all these features. They’re especially important in fast-moving markets like cryptocurrency trading, where price swings can be sharp and decisions must happen quickly.
Professionals also care about stability. A crash during a trade can lead to big losses. That’s why they choose tested and trusted platforms like ATAS. When execution and data both matter, strong charting software for trading makes a real difference.
Conclusion: The Edge Lies in the Details
There’s no such thing as a perfect trade, but there are better decisions. Those come from better tools and clear data. Traders who take the markets seriously don’t rely on basic setups.
They use advanced platforms and analytics, like ATAS, to read price action, see volume, and act when the time is right. They don’t wait for confirmation — they already saw it coming in the data.
This doesn’t mean profits are guaranteed. But when you can see more and act faster, you give yourself a real edge. And in fast-paced markets, that edge is the key to professionals staying ahead of the curve.


