The stock market has always been a battlefield of information, where the well-prepared often outpace the unprepared.
Today, however, that battlefield looks very different. With billions of trades executed daily and algorithms influencing price moves in milliseconds, human intuition alone can’t keep up.
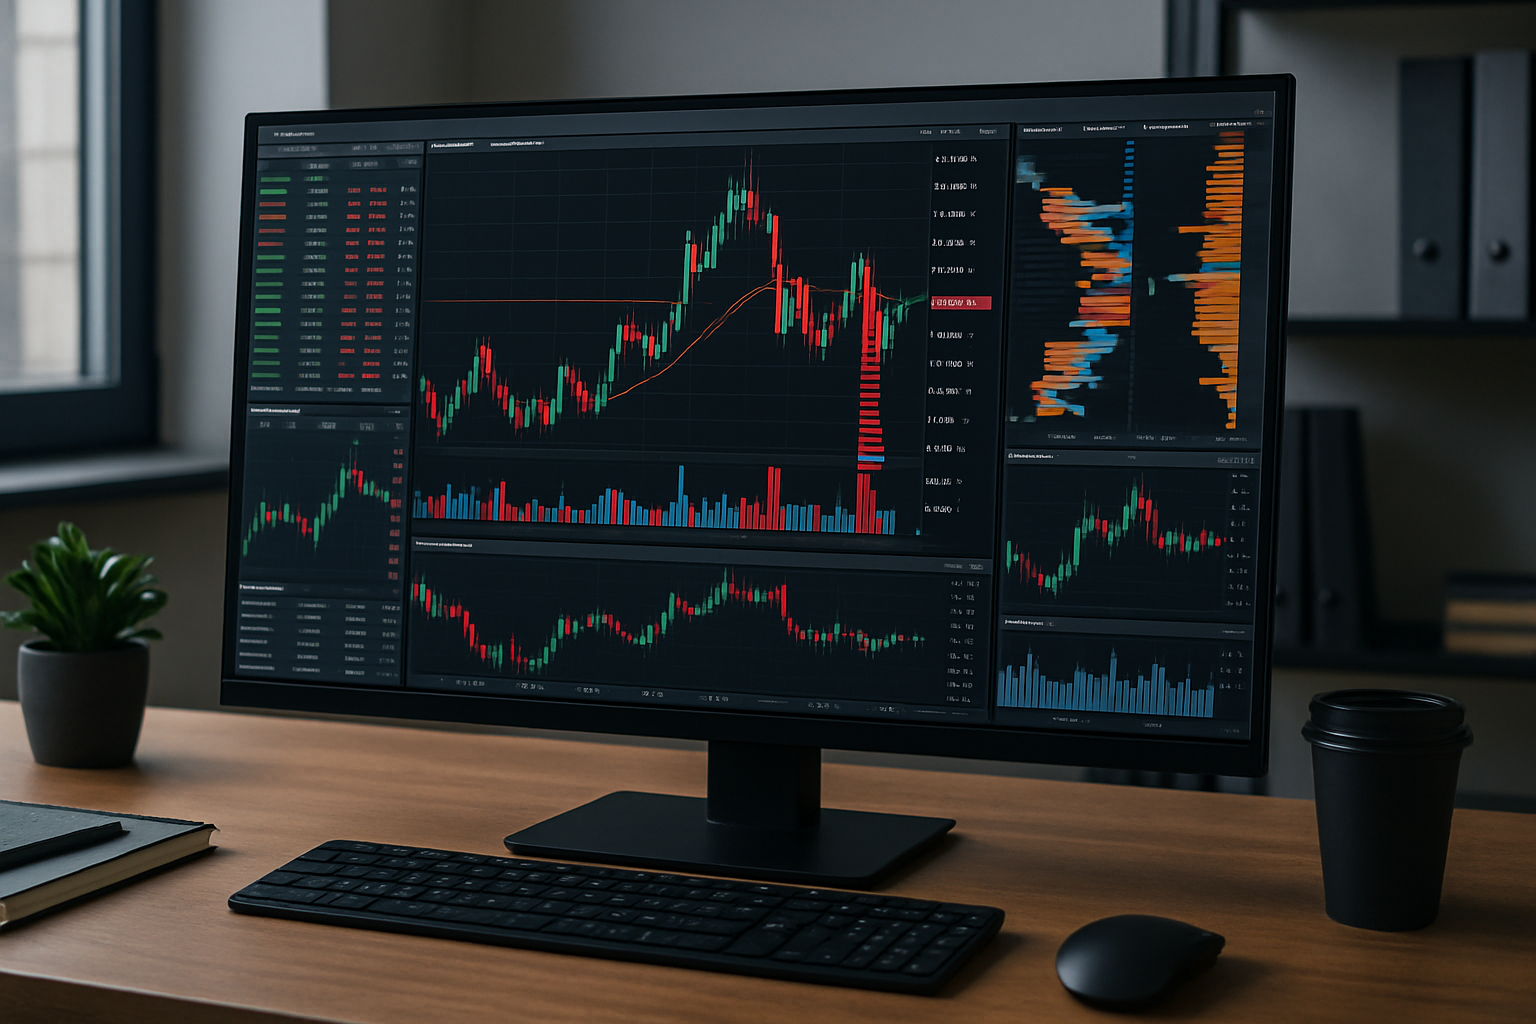
This is where modern software for stock analysis steps in. By turning raw numbers into clear insights, these platforms help traders see beyond surface-level charts, uncover order flow dynamics, and identify the stocks most worth watching.
In short, the right stock market analysis tool can mean the difference between chasing trends and leading them.
The Shift From Gut Instinct to Data-Driven Trading
Trading once carried a reputation for being part skill, part intuition, and part luck. While instinct will always play a role, relying on hunches alone is no longer enough.
The markets have grown too complex, with algorithmic trading, institutional flows, and cross-market signals shaping price action in milliseconds.
Modern tools for stock analysis fill this gap. They process thousands of data points in real time, providing traders with the transparency they need.
Whether you’re analyzing order flow stocks or scanning for volume clusters, the ability to visualize what’s really happening under the surface is a game-changer.
What Makes a Stock Market Analysis Tool Essential?
A good stock market analysis tool does more than show historical prices. It integrates multiple layers of data, helping traders interpret the forces that drive supply and demand. Let’s break down the core reasons these tools are indispensable:
1. Real-Time Market Transparency
Seeing bid-ask spreads and depth of market (DOM) in real time helps traders evaluate liquidity and anticipate moves.
2. Order Flow Insights
Order flow analysis shows who is buying and selling, how aggressively they’re acting, and whether market sentiment is shifting. For day traders, this is often the difference between catching a breakout and getting trapped.
3. Volume Profile and Cluster Charts
By analyzing where volume concentrates, traders understand which price zones hold support or resistance. This data also reveals whether large players are entering or exiting positions.
4. Customizable Technical Indicators
No two traders are alike. The best software lets you tailor indicators and overlays to fit your strategy—whether it’s scalping, swing trading, or long-term investing.
Order Flow Stocks: The Hidden Layer of Market Behavior
Among all features, order flow analysis stands out. Instead of only seeing what happened in the past, you can witness trading activity as it unfolds.
Order flow stocks analysis uncovers:
- Aggressive buyers vs. sellers: Who is crossing the spread to get filled immediately.
- Absorption zones: Where big players absorb liquidity without moving price.
- Iceberg orders: Hidden institutional activity that reveals supply or demand imbalances.
For example, imagine a stock trading sideways. Price alone looks boring, but order flow may show repeated large bids absorbing sellers. That clue can signal a pending rally—something invisible to a trader who relies solely on candlesticks.
How Advanced Software for Stock Analysis Changes the Game?
Traditional charting tools have their place, but advanced software for stock analysis elevates trading to a higher level. Platforms like ATAS, Bookmap, and Sierra Chart deliver granular insights that were once reserved for institutional desks.
With these platforms, traders gain access to:
- Footprint charts that show volume at bid vs. ask.
- Heatmaps that track liquidity pools.
- Cumulative delta indicators reveal whether buyers or sellers dominate.
- Cluster analysis identifying micro-imbalances.
Midway through your trading journey, you’ll likely realize that general charting platforms aren’t enough. They can show price history, but they don’t reveal the deeper dynamics of supply and demand. That’s when upgrading to professional software for Stock Analysis becomes essential.
Tools like ATAS provide intuitive interfaces paired with advanced analytics such as order flow, footprint charts, and volume profiles — making complex market data digestible for both beginners and pros.
ATAS also connects to multiple global exchanges and updates regularly, ensuring traders always work with fresh insights and reliable features.
The Psychology Edge: Confidence Through Clarity
Trading is not only about numbers; it’s about psychology. Uncertainty breeds hesitation, and hesitation often leads to missed opportunities.
When using a modern stock market analysis tool, the fog lifts. Seeing order flow confirm your setup, or spotting clusters that validate your bias, gives confidence. This clarity reduces emotional trading—helping you stick to strategy rather than reacting impulsively.
Stocks for Traders: Who Benefits Most From These Tools?
Not every market participant trades the same way. Let’s examine how different types of stocks for traders strategies benefit from modern analysis software:
Day Traders
They rely heavily on intraday data. Order flow and volume profile help them spot breakout zones, reversals, and high-probability setups.
Swing Traders
They use analysis to refine entry and exit points within broader trends. Knowing where institutions are positioning gives them an advantage over standard chart readers.
Long-Term Investors
Even position traders can benefit. Understanding market microstructure helps confirm whether an asset is accumulating strength or facing hidden distribution.
Options Traders
Order flow stocks insights help options traders gauge whether implied volatility aligns with real demand.
Key Features to Look for in a Stock Market Analysis Tool
With many platforms available, choosing the right tool for stock analysis requires careful consideration. Here are the must-have features:
- Depth of Market (DOM): Visualize liquidity levels.
- Footprint Charts: Analyze bid/ask volumes.
- Volume Profiles: Identify strong support and resistance zones.
- Real-Time Alerts: Get notified when unusual activity occurs.
- Customizable Workspaces: Adapt the platform to your trading style.
- Cross-Asset Coverage: Analyze futures, stocks, and crypto on one platform.
Case Example: Using Order Flow to Spot Breakouts
Imagine trading a tech stock at $120. The chart shows consolidation, but footprint analysis reveals heavy buying at $121 despite sellers trying to push the price lower. Soon, a breakout to $125 follows.
Without modern software for stock analysis, this setup might look like random noise. With order flow visibility, the trader recognizes institutional accumulation and rides the move with confidence.
Why Human Skill Still Matters?
While technology gives traders an incredible edge, it doesn’t eliminate the need for human judgment. No matter how advanced a stock market analysis tool becomes, it’s still a tool — it provides the map, but you must decide which route to take. Successful trading combines advanced data with human discipline, intuition, and decision-making.
Discipline
The most advanced trading software can highlight opportunities, but it can’t prevent emotional mistakes. Overtrading, chasing losses, or abandoning a strategy out of fear are all human errors.
Discipline means sticking to your plan, even when market signals tempt you to act impulsively. Without it, even the best insights from modern platforms can go to waste.
Risk Management
No software can replace proper risk management. Stop losses, position sizing, and diversification are still your responsibility as a trader.
A tool can show you where institutional buyers are stepping in, but it won’t stop you from putting too much capital on the line. Long-term survival in the markets depends on consistently protecting your downside, not just finding winning trades.
Contextual Thinking
Charts and order flow don’t exist in a vacuum. News events, macroeconomic conditions, earnings reports, and even trader psychology can reshape market dynamics in seconds.
For example, strong buying pressure might appear in a stock, but if a negative earnings report is due in hours, that context changes everything. Only human judgment can balance raw data with broader awareness.
Adaptability
Markets evolve, and no software can guarantee that today’s edge will work tomorrow. Traders must constantly adapt — testing strategies, adjusting indicators, and learning from mistakes.
The ability to stay flexible, to recognize when conditions change, is uniquely human. Software enhances your perspective, but adaptability ensures your survival.
The Future of Stock Analysis Software
Looking ahead, we can see that stock analysis software will become powerful enough to be entirely integrated into the trading process. Markets move fast and are now competitive, and the trader-demanded instruments should keep pace.
Among the major changes already affecting the industry are artificial intelligence and machine learning, which are being trained to analyze market data through the years, like order books, historical volume, and price action for platforms that would then start identifying patterns that the naked eye would miss.
Therefore, rather than just showing the traders what is happening, the new-gen tools may also suggest what may happen, for example, liquidity might show up or when the momentum might change.
Convenience will remain another strong driver of disruption after predictive analytics. Cloud-based customization is bringing in the next phase of innovation, where traders can save layouts, templates, and indicators and then log in on any device and use them.
Imagine starting in a trading desk, then shipping off to lunch on a laptop brainwave, and checking some updates on the phone, all on one workspace and all being synced in real time. Mobile trading, in particular, is set to evolve far beyond basic charts.
Traders will soon be able to carry fully functional stock market analysis tools in their pocket, with no compromise on performance.
Conclusion: Gaining the Edge
In modern markets, information is power. A reliable tool for stock analysis empowers traders to see what the majority cannot — hidden liquidity, order flow shifts, and volume imbalances.
Whether you trade intraday, swing, or long term, having the right stock market analysis tool bridges the gap between guesswork and precision.
By leveraging platforms like ATAS, traders transform raw data into actionable insights. The edge is no longer about who has faster news—it’s about who interprets order flow stocks and clusters with clarity. For those serious about success, investing in advanced software for stock analysis is not optional; it’s essential.